The current 2026 ranking weighs demand, revenue potential, and purchase price relative to projected short-term rental income. The top 10 Airbnb investment markets are:
- Port Arthur, Texas
- Abilene, Texas
- Downtown Saint Paul, Minnesota
- Charleston, West Virginia
- Springfield, Illinois
- Lake Charles, Louisiana
- Montgomery, Alabama
- Akron, Ohio
- Lebanon, Pennsylvania
- Jackson, Mississippi
10 Best Airbnb Investment Markets 2026
The 2026 market ranking evaluates U.S. properties currently for sale using demand, revenue potential, and purchase price relative to projected STR income. Across the top ten, the published figures average about $296,000 for home price, $40,500 for annual revenue potential, and nearly 14% expected gross yield. These are market-level estimates, not property-level forecasts.
The market metrics below were published on January 27, 2026. Use them as an initial screening tool and verify every figure with current property-level comparables before making an investment decision.
1. Port Arthur, Texas
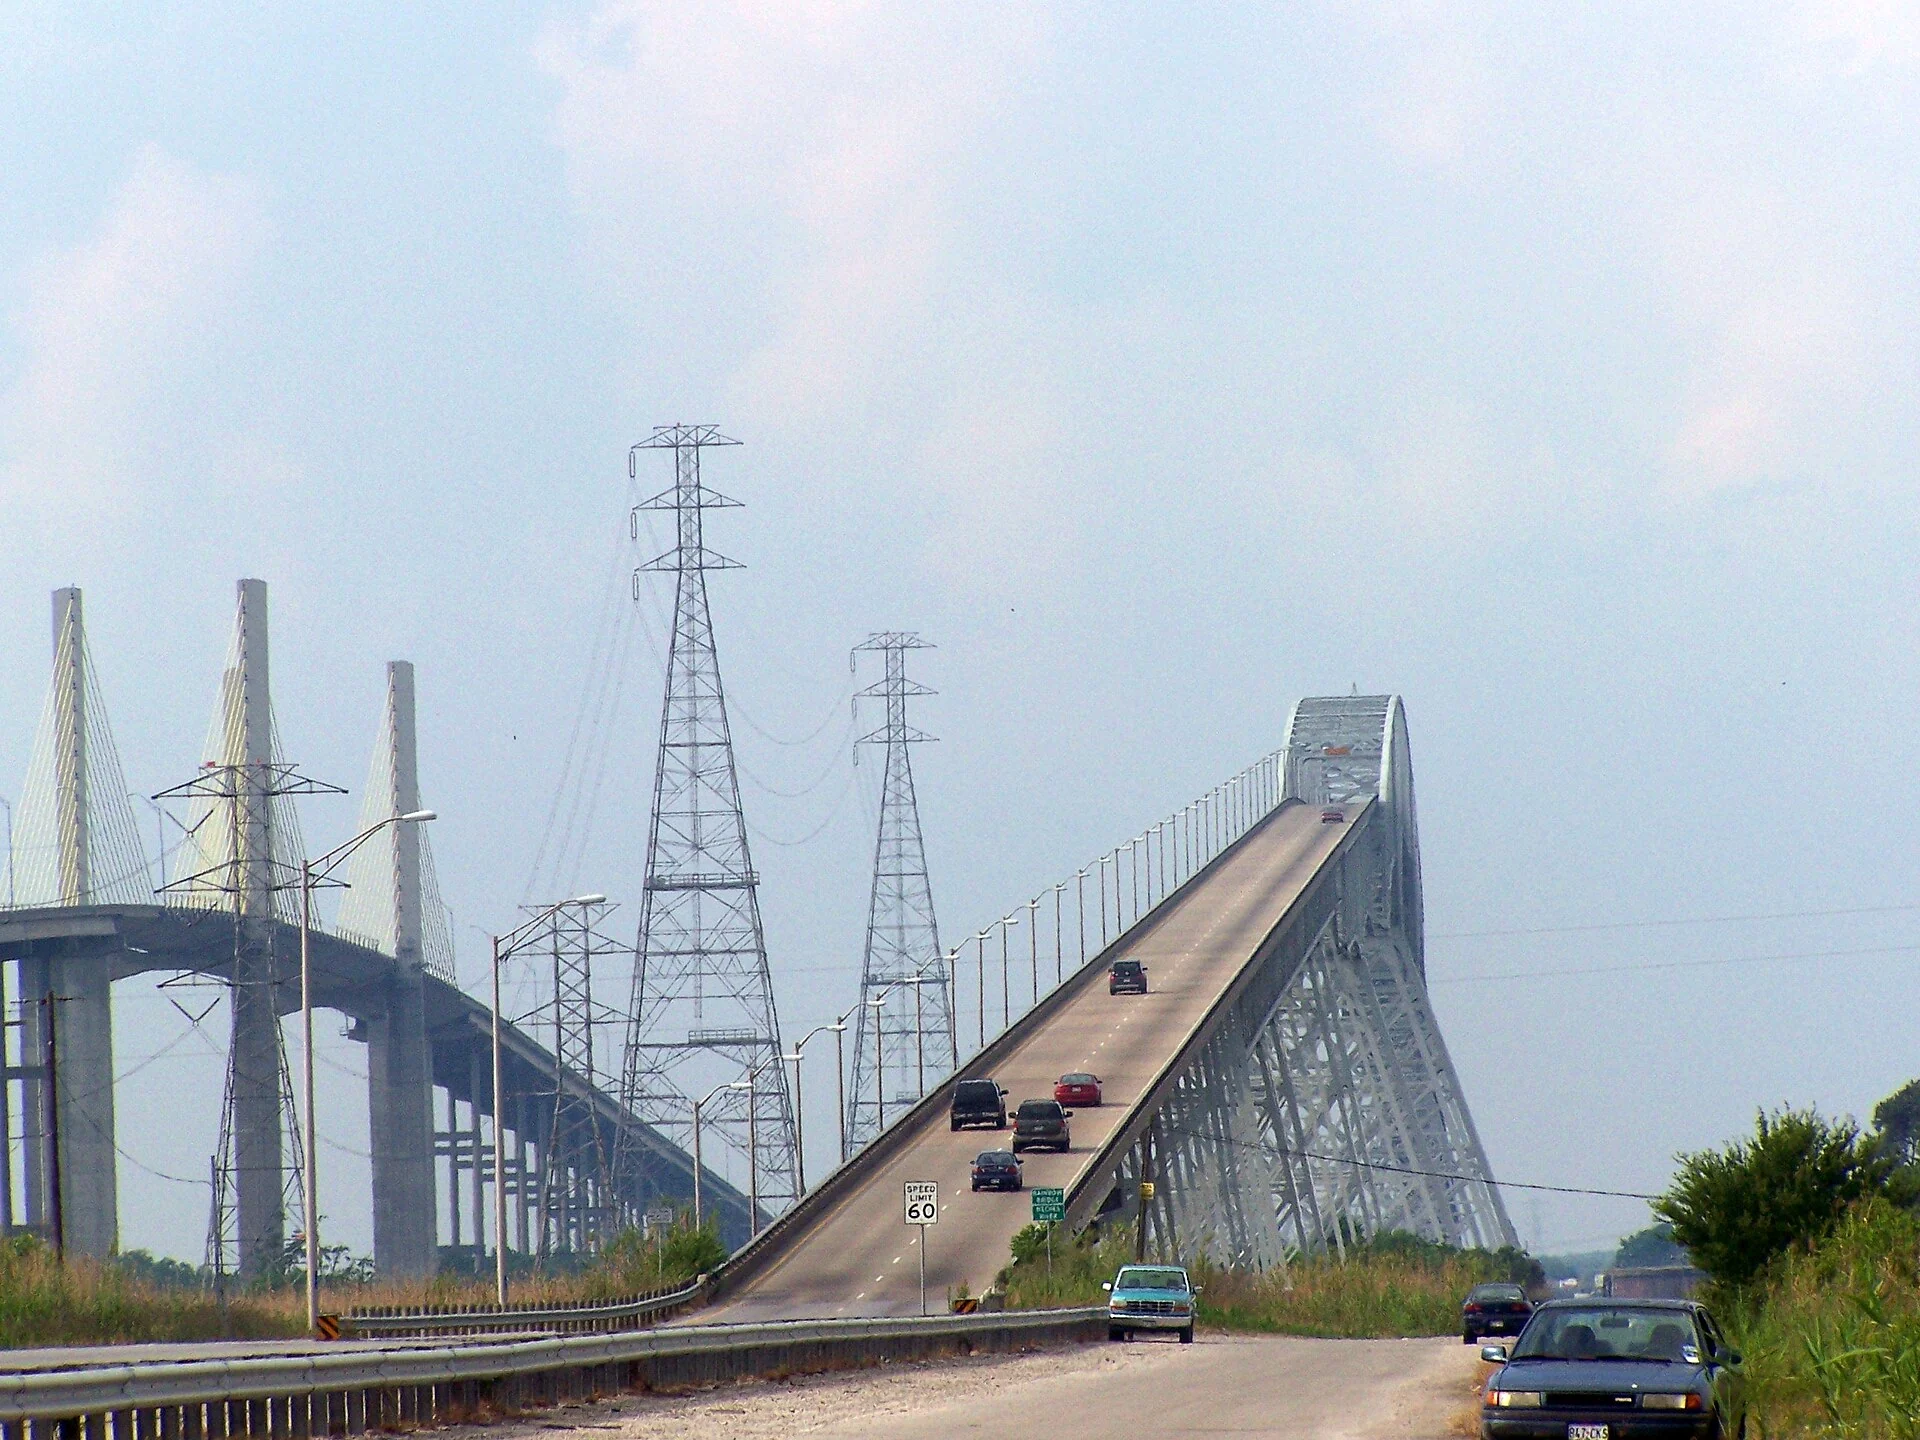
Workforce and extended-stay demand tied to refining, shipping, energy construction, and infrastructure combines with Gulf Coast leisure travel.
2026 Data Snapshot:
- Average home price: $243,000
- Annual revenue potential: $35,000
- Expected gross yield: 14.4%
- Occupancy rate: 77.6%
2. Abilene, Texas

Dyess Air Force Base, healthcare, universities, and major infrastructure development support year-round lodging demand.
2026 Data Snapshot:
- Average home price: $336,000
- Annual revenue potential: $55,000
- Expected gross yield: 16.4%
- Occupancy rate: 77.2%
3. Downtown Saint Paul, Minnesota

State government, major employers, hospitals, conventions, sports, and cultural attractions create a diversified urban demand base.
2026 Data Snapshot:
- Average home price: $331,000
- Annual revenue potential: $45,000
- Expected gross yield: 13.5%
- Occupancy rate: 64.1%
4. Charleston, West Virginia

State government, Charleston Area Medical Center, regional industry, and downtown events support business, medical, and leisure stays.
2026 Data Snapshot:
- Average home price: $228,000
- Annual revenue potential: $32,000
- Expected gross yield: 14.1%
- Occupancy rate: 62.9%
5. Springfield, Illinois

State government, Lincoln historic sites, regional events, and the Illinois State Fair contribute to recurring demand.
2026 Data Snapshot:
- Average home price: $262,000
- Annual revenue potential: $35,000
- Expected gross yield: 13.2%
- Occupancy rate: 66.0%
6. Lake Charles, Louisiana

Petrochemical employers, the port, and aviation activity at Chennault Airpark generate substantial workforce and business travel.
2026 Data Snapshot:
- Average home price: $287,000
- Annual revenue potential: $37,000
- Expected gross yield: 12.7%
- Occupancy rate: 60.6%
7. Montgomery, Alabama

Government, military, healthcare, education, and regional tourism provide several sources of short-term lodging demand.
2026 Data Snapshot:
- Average home price: $342,000
- Annual revenue potential: $42,000
- Expected gross yield: 12.2%
- Occupancy rate: 62.6%
8. Akron, Ohio

Hospitals, universities, employers, Cuyahoga Valley National Park, and proximity to Cleveland support a varied guest mix.
2026 Data Snapshot:
- Average home price: $297,000
- Annual revenue potential: $39,000
- Expected gross yield: 13.1%
- Occupancy rate: 62.4%
9. Lebanon, Pennsylvania
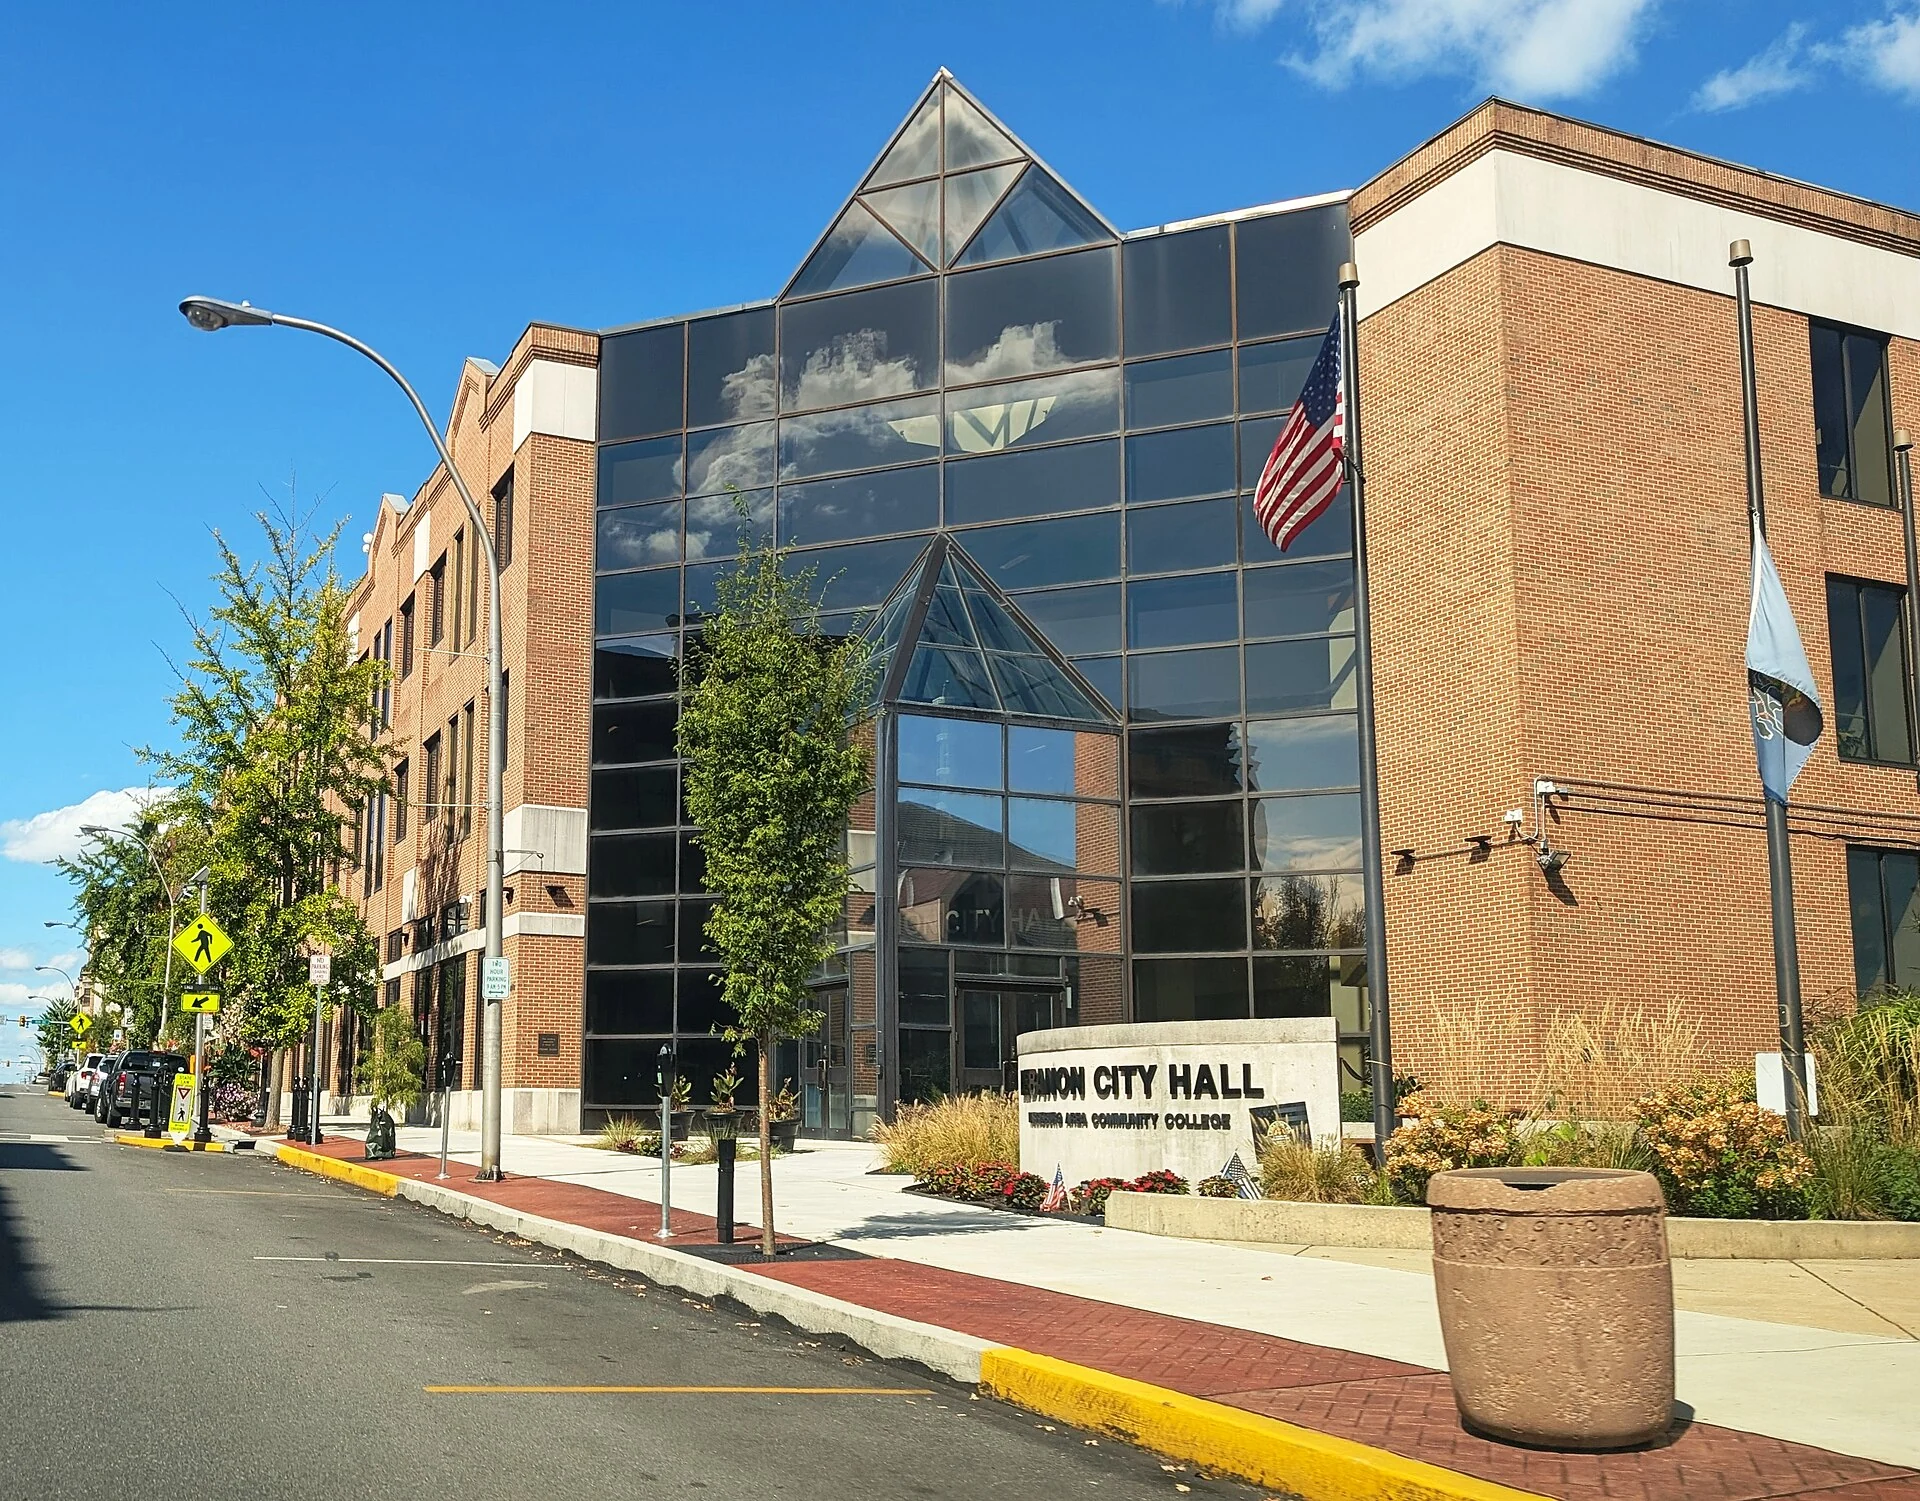
Its location between Hershey and Lancaster and proximity to Fort Indiantown Gap support family, leisure, and military-related stays.
2026 Data Snapshot:
- Average home price: $265,000
- Annual revenue potential: $42,000
- Expected gross yield: 15.7%
- Occupancy rate: 59.2%
10. Jackson, Mississippi

Medical, university, government, convention, and cultural demand supports both weekday and weekend bookings.
2026 Data Snapshot:
- Average home price: $366,000
- Annual revenue potential: $44,000
- Expected gross yield: 11.9%
- Occupancy rate: 64.4%
Ranking data is a screening tool. Before buying, verify city and county rules, permitting, taxes, insurance, financing, property condition, and comparable-listing performance. Regulations and property-level results can differ materially within the same market.
Why a Data-Driven Approach to STR Investing is Important
Many aspiring investors make a critical mistake. They choose markets based on personal preference rather than performance metrics. "I love visiting Myrtle Beach, so I'll buy there" might seem intuitive, but this "vibe check" approach overlooks crucial factors like local regulations, market saturation, and economic drivers that determine profitability. The best investment markets aren't the most popular vacation destinations; they're up-and-coming Airbnb markets where the numbers work in your favor. Like Texas short-term rental opportunities that prioritize strong fundamentals over personal bias. Once you've identified the right market through data-driven analysis, understanding how to buy your first Airbnb property becomes the next critical step in your investment journey.
STR underwriting should compare cap rate, cash-on-cash return, average daily rate (ADR), occupancy, seasonality, and local taxes. These metrics create a consistent framework, but they do not guarantee future performance. Test conservative, expected, and downside scenarios before making an offer.
Key Metrics Defining the Best Airbnb Markets
Before exploring specific markets like the best Florida cities for investment and other undervalued Airbnb markets, understand the five key metrics professional STR investors use to evaluate opportunities. These numbers, along with state tax considerations, reveal a market's performance and help predict future returns. Once you've identified promising markets using these metrics, you'll be ready to learn how to buy your first Airbnb property in those locations.
Capitalization (Cap) Rate
Cap Rate = Net Operating Income / Property's Market Value
This fundamental real estate metric measures the unleveraged return on your investment. If a property generates $30,000 in annual net operating income (after all expenses except mortgage) and costs $300,000, the cap rate is 10%. When evaluating potential investments across different areas, you can calculate your ROI for each market to compare opportunities, keeping in mind that local tax obligations and market-specific pricing strategies will impact your overall profitability. Understanding these calculations is essential when learning how to buy your first Airbnb property.
Cap rate is a common way to compare properties without allowing financing terms to distort the comparison. There is no reliable cap-rate threshold that makes an STR a good investment in every market. Use consistent revenue and operating-expense assumptions, then compare the result with local alternatives and an Airbnb ROI analysis.
Cash-on-Cash (CoC) Return
CoC Return = Annual Pre-Tax Cash Flow / Total Cash Invested
If you invest $80,000 as a down payment and closing costs on a property that generates $12,000 in annual cash flow after all expenses, your cash-on-cash return is 15%. For those ready to take the next step, buying your first Airbnb property in undervalued markets requires careful planning, execution, and understanding which best Airbnb property types will maximize your returns in each location. All of which starts with using an Airbnb investment calculator to validate your financial projections.
Cash-on-cash return is especially useful for investors using financing. While cap rate measures property-level performance before debt, cash-on-cash return shows the annual pre-tax cash flow produced by the cash invested. A target return should reflect financing costs, operating risk, local alternatives, and the investor’s goals rather than a universal percentage.
Average Daily Rate (ADR)
The average daily rental income when the property is occupied.
ADR directly impacts your top-line revenue. A high ADR property can generate substantial income with fewer booked nights. However, ADR must be contextual. A $500/night property that only books on holidays won't outperform a $200/night property with consistent bookings. When evaluating properties, you can calculate your potential returns to see how ADR affects overall profitability, especially when considering best Airbnb property types for your target market. ADR helps you understand your target guest demographic and the amenities and services needed to justify your rates.
Occupancy Rate
The percentage of available nights that the property is booked.
A high ADR means little if the calendar is empty. Occupancy helps measure rental demand and forecast revenue stability, but it must be read alongside ADR, seasonality, available supply, and local event patterns. Compare occupancy with directly competing properties instead of relying on one nationwide threshold.
Seasonality & Revenue per Available Room (RevPAR)
RevPAR = ADR × Occupancy Rate
This metric combines rate and occupancy to show your actual revenue generation per available night.
RevPAR is useful because it combines pricing and occupancy. Review it by month, not only as an annual average, because strong peak-season results can hide weak off-periods. Markets with several demand drivers may produce steadier revenue, but property-level underwriting and current local regulations still determine whether a specific deal works.
How to Maximize Your Tax Savings
Some short-term rental owners may be able to use nonpassive losses against other income, but only when the activity and the taxpayer satisfy the applicable tax rules. The result depends on average guest stay, services provided, material participation, basis, at-risk limits, and other facts.
Under IRS Publication 925, an activity with an average customer-use period of seven days or less is not treated as a rental activity for passive-activity purposes. If the taxpayer materially participates, the activity may be nonpassive. Material participation does not itself make someone a real estate professional; that is a separate test requiring more than 750 hours and more than half of the taxpayer’s personal-service time in qualifying real property trades or businesses.
A cost-segregation study may identify building components eligible for shorter recovery periods. IRS guidance currently provides 100% additional first-year depreciation for certain qualified property acquired and placed in service after January 19, 2025, but eligibility and the treatment of any resulting loss depend on the taxpayer’s facts. Work with a qualified tax professional before relying on projected tax savings.
Conclusion
Finding the best places to own an Airbnb requires a data-driven strategy that identifies favorable markets. By understanding key metrics like Cap Rate, Cash-on-Cash Return, and RevPAR, you can evaluate opportunities objectively and build a portfolio for immediate cash flow and long-term appreciation.
Investing in real estate does not have to be a solo process. STR Search provides market analysis and property-level underwriting to help investors compare opportunities with their financial goals, risk tolerance, and available capital.
Ready to take the next step? Your first high-return STR property is closer than you think. Book your complimentary, no-obligation Live Property Analysis Session with our team today and see how our data-driven process can work for you. Let us show you what is possible with the right market, property, and strategy.